Thursday, December 31, 2020

Bluefly vario precision

Rolling resistance coefficient @5°C (Crr) 0.0075

Wednesday, December 30, 2020

Chain losses

It seems that the lower the speed, the lower the chain losses. The auto-zero feature of my G3 has a flaw which explains the variations (0-7%). But there is one moment (near 1 hour) where no coasting happened and chain losses decreased from 2% (@40km/h) to 0% (@20km/h).

Monday, December 28, 2020

Live CdA

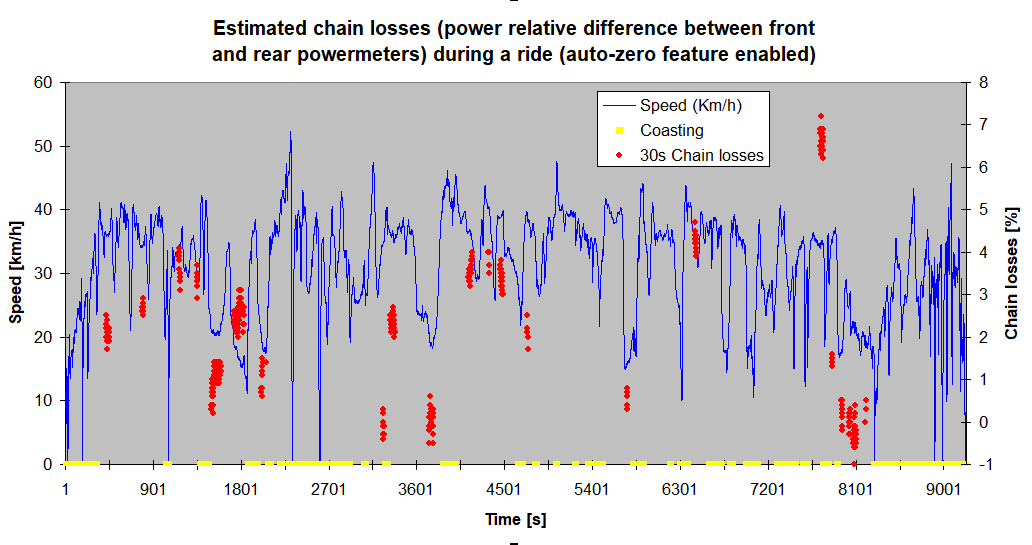
Lot of data to monitor today: instantaneous wind, estimated chain loss (30s average) and real time CdA (~60s average, +/-0.005 precision). Fun to play with the last feature to set a low mark at 0.285. Again seen some oddities to food the geek mind during this cold ride.


Sunday, November 8, 2020

News

 The app is not available anymore for download and support is stopped since November 2020.

Sunday, June 7, 2020

Elevation profiles


Ok, up to now, it is the best measured elevation (normalized at 0 for start/end of the lap) profile I get for my virtual wind tunnel venue. I rode slowly (18-20 km/h) on the 3420m of the venue and recorded data with the Joule 2.0 computer which had a great resolution (0.1m). The elevation is normalized in order to have H(0)=H(L)=0m.

Update 2020/07/15:
Added data during a ride (30-32 km/h) from the Blue Fly Vario variometer (named here BFV) built on a MS5611 barometer inside (providing same 0.1m resolution for elevation). Profiles are very closed, but we can notice that during the ride at higher speed with the BFV, the barometer reported lower altitude at some points (eg: 750-1200m), but not everywhere (eg: 250-500m).