
Cheap DIY bike system monitoring CdA (aero drag) and Crr (rolling resistance) coefficients, with an Android app connected to an anemometer, a powermeter, and a speed sensor.
Sunday, December 3, 2017
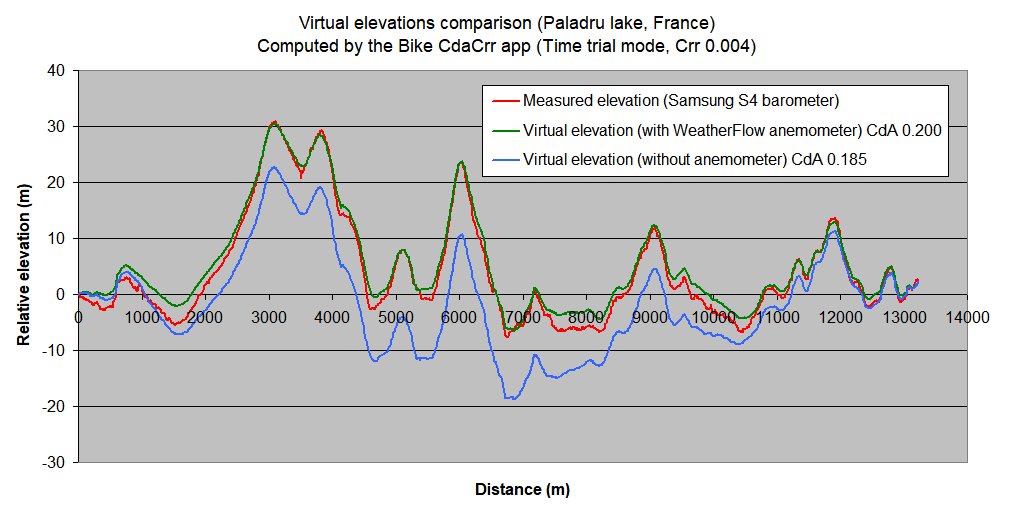
Virtual elevations
Monday, August 7, 2017
Track model
According to Google Maps, the 250 meters track has straight of length 74.8 meters and turn radius of 16.0 meters.

The measured incline along the black line in the turns is ~30°, for 6° in the straights.

The measured incline along the black line in the turns is ~30°, for 6° in the straights.
Friday, March 17, 2017
Velodrome session with high wind
Back to the outdoor velodrome. I wanted to see if the anemometer could improve precision with high wind conditions. The results, after three runs of 10 laps (trying to keep the same relaxed position on the hoods of my road bike) are:

We can notice that the wind, measured near the ground (the anemometer was mounted on the drops), is in the 5-15 km/h range (weather station indicated 22 km/h this day).
Quick updated conclusions for the moment:
- with low and constant wind conditions (0-5 km/h), data anemometer is useless as the effect is nearly cancelled (CV~1-2%)
- with higher wind conditions (>5 km/h), anemometer is mandatory to maintain acceptable precision (CV~1.5-3%) whereas for apparent CdA (wind data is not included into the model) variability is way of.
- variability from run to run is still an issue in my protocol (0.343, 0.353, 0.342) even if it should be lower with the use of a time trial bike.
Saturday, January 21, 2017

Sunday, January 15, 2017
Outdoor velodrome with an anemometer

On an outdoor velodrome (250m length), the rider selected the "Defined lap length" mode in the app and did a first run of 28 laps, then a second run of 22 laps. The Weather Meter anemometer, which is mounted on the front of his TT bike, records axial apparent speed:

We clearly see that the wind, during the session, is not constant at all, and has a range of [1-5] km/h. The mean axial wind, on the whole session, is -0.19 km/h. It indicates that the calibration factor used in the app to take in account the stagnation effects seems slightly underestimated. It is confirmed by the computation of real CdA vs apparent CdA (air vs bike speed in the drag force):
First run:
0.303 +/-0.006 (CV: 1.8%)
0.301 +/-0.005 (CV: 1.8%)Second run:
0.308 +/-0.003 (CV: 0.9%)
0.304 +/-0.005 (CV: 1.7%)
The apparent CdA is lower than the real CdA during the two runs, which is unexpected. Nevertheless, even if there is a biais on the real CdA, we can notice two things:
-Variability is low for the real CdA, which is a very good point for the validation of the anemometer
-During out and back ride or velodrome testing, apparent CdA is accurate enough when wind is low (less than 5 km/h) as the effect is nearly cancelled in the drag force
Subscribe to:
Posts (Atom)